Inspired by Crazy Taxi at coolmathgames.com.
In this project, my lab partner and I recreated one of our favorite childhood games, Crazy Taxi, for the FPGA. You’ll need a VGA monitor and a USB keyboard to play our multiplayer masterpiece, but don’t worry if you don’t have access to these devices. I have pictures!
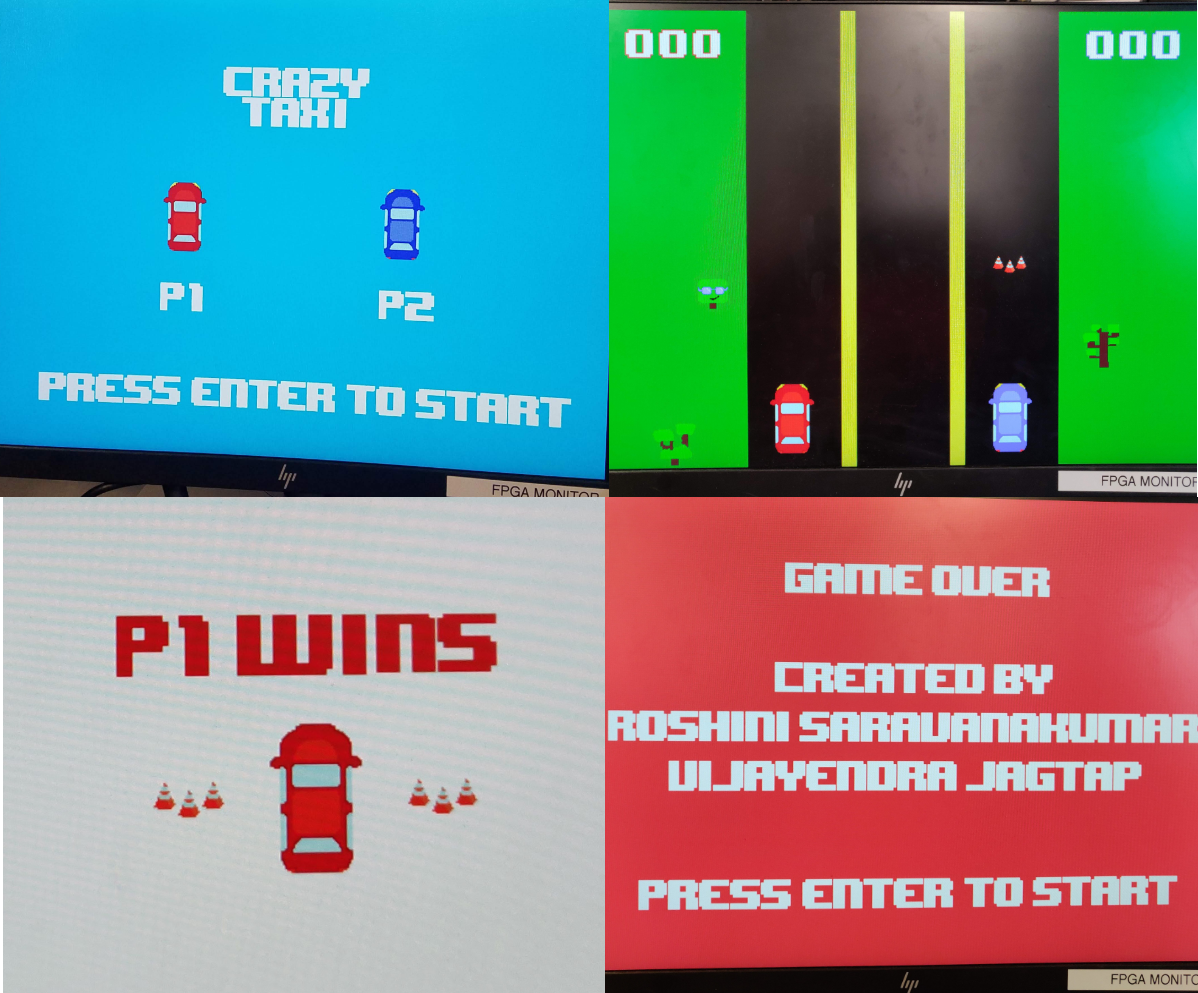
Our game, which is written entirely in SystemVerilog and C, utilizes the VGA monitor for display and the USB keyboard for user controls (WASD and the four directional arrows to support multiplayer). The main gameplay consists of two user-driven cars (Red and Purple) that dodge randomly generated traffic cones on a highway scene by jumping and switching lanes. If a car collides with a traffic cone, the other player automatically wins. Throughout the game, we also dynamically display the distance traveled by each car on the top of the screen.
All sprites used in the game are my original custom designs. To reduce our On-Chip Memory usage, we have written a Python script to map the colors used in our sprites to palettes so that our sprites only use 1 to 4 bits per pixel (1 bit in the case of text sprites). We have also implemented full collision handling which ensures that the cars cannot collide with each other or the road boundaries. In addition, we have implemented game scrolling so that the highway scrolls vertically as the players drive, which can be observed as the trees alongside the road scroll with world. To randomly generate the cone obstacles, we used a 3-bit Linear Feedback Shift Register (LSFR), where each bit corresponds to the state of a cone’s existence in each of the three lanes. Since we wrote modules to implement custom drawing routines for each sprite, we can easily remove sprites from the screen as well as detect collisions through the coordinates at which a sprite is being drawn.
Our game is controlled by a finite state machine with 5 states that represent: the start screen of the game, the custom transition that I have programmed to move the cars to their starting positions for the race, the game itself, the results screen which displays which player won, and the ending screen with the end game credits. Pictures of each of these states can be found below.
If you would like to discuss this project or the implementation, feel free to contact me! I have invested a lot in this game and would love feedback on it! 😄
I'm currently a Remote Sensing Data Science Intern at Corteva Agriscience at the University of Illinois at Urbana-Champaign Research Park branch. I'm efficiently processing and visualizing large remote sensing datasets and raster images using Python, Bokeh, Rasterio, and Panel to develop an interactive and flexible dashboard with linked plots for farmers to explore local crop yields, weather data, growth cycle data for their own crops, and crop yield predictions for the upcoming season.
Produce Flow refers to the global flow of produce across countries and regions. Through this series of original visualizations, we have created an invaluable analytics tool to study individual crop flows or country flows to allow users to explore data provided by the Food and Agriculture Organization of the United Nations. Visit the project website to learn more!
With my recent endeavor to move towards a plantbased lifestyle, I decided to create a visualization that would help new vegetarians and vegans find dining locations across the U.S. in their ideal price range and in a variety of cuisines. My team and I created this learning experience by designing a U.S. map visualization featuring custom tooltips that display further restaurant information (price range, city, cuisines) and and an easy-to-read legend to help users find restaurants in any price range.
In this project, my team and I used pandas to clean and organize a UIUC dataset that contained enrollment statistics for all majors on campus. We chose to focus on how the undergraduate enrollments for each major and each college have changed over the past 14 years. To do this, we used D3.js and JavaScript to create a slope graph to display the growth and fall of the number of undergraduate students enrolled for each major. I designed custom tooltips for each slope line that display the major's name and the overall change in enrollment counts for in-state, out-of-state, and international students with this major.
As a student in the class, I learned so much in office hours, so I chose to give back to the class by joining the course staff. I hold weekly office hours to help students master course material (x86 ISA, interrupt support, synchronization, file systems, VGA, scheduling) and overcome bugs and conceptual challenges when writing code. I also grade machine problems, exams, and the final operating system project demo. I am currently working on a project that uses decision trees to categorize Office Hours queue data from Spring 2019 by assignment. I hope to display insights on an interactive visualization that will be helpful to both the course staff and students.
In this project, my team and I built our own operating system in 3 months using x86 Assembly and C. I set up interrupt handling with assembly linkage for exceptions and hardware interrupts (keyboard, RTC, PIT). I also parsed the given read-only filesystem, provided support for all read-only filesystem operations (open, close, read) through system calls, and developed assembly linkage for system calls through the Interrupt Descriptor Table. Additionally, I implemented two system calls, execute and halt, which perform a context switch to run and return from user-level programs respectively. I also designed the process control block to contain a file operations jumptable and a file descriptor array so that we could handle multiple processes. Throughout the project, we created a comprehensive set of unit tests to ensure that all components were functioning as expected.
We created a restaurant recommendation app for University of Illinois students! I used React, Node.js, and AWS (Cognito, Aurora, DynamoDB) to build an intuitive and clean interface for students to interact with our data. Visit the project website to learn more!
Produce Flow refers to the global flow of produce across countries and regions. Through this series of original visualizations, we have created an invaluable analytics tool to study individual crop flows or country flows to allow users to explore data provided by the Food and Agriculture Organization of the United Nations. Visit the project website to learn more!
This website was designed 100% from scratch! 🌻🎨🖌️ No templates, no themes. Just my imagination. 🌈